Product Manager
Product Strategy, UX Design, Analytics Engineering & Dashboard Design
Designing a Consumer Price Intelligence & Brand Demand Analytics Platform
"The project stopped being a price tracker the moment I realized that target prices could become demand signals."
An end-to-end product that combines Product Management, UX Design, Data Engineering and Analytics to help consumers make smarter purchase decisions while providing brands with actionable demand intelligence.
Product Strategy, UX Design, Analytics Engineering & Dashboard Design
From discovery to deployment
Playwright, Power BI, Figma & Git
Consumer Intelligence + Brand Demand Analytics
Building a product that reflects how I think—not just what I can build.
When I started building DemandTrigger, my goal was simple: create a project that reflected how I think as a Product Manager, not just what I can code. I wanted to work on a problem that combined product strategy, data, engineering and business thinking into a single end-to-end solution.
What began as a straightforward price tracker soon revealed a much more interesting opportunity underneath it. The problem I set out to solve turned out to be a symptom of something much larger, and that realization completely changed the direction of the project.
The project started with a familiar consumer problem, but the solution I wanted wasn't the one existing price trackers were trying to solve.
Whenever I planned to buy an expensive gadget, I found myself repeating the same routine. I would compare prices across multiple e-commerce websites, wait for discounts, and check again a few days later, hoping the price had dropped.
It wasn't particularly difficult, but it was simply repetitive. More importantly, it was easy to forget. While exploring existing price tracking tools, I realised that most of them solved the same problem: monitoring current prices and notifying users when those prices changed.
But that wasn't actually the question I cared about.
The question I actually wanted to answer was different.
A simple product decision unexpectedly revealed a completely different source of business value.
That question became the foundation of DemandTrigger. Instead of asking users to monitor prices continuously, I wanted them to define their target price once and let the platform notify them only when that condition was met.
While designing this experience, I realised that every target price represented more than an individual preference. It reflected what someone believed a product was actually worth.
Aggregated across thousands of users, those target prices become demand intelligence. They reveal customer pricing expectations before a purchase happens—creating insights that brands can use for pricing, promotions and inventory planning.
One of the biggest shifts during the project was realising that the same dataset could solve completely different problems for two different users.
Consumers want to make informed purchase decisions without constantly checking prices across multiple retailers.
By setting a target price once, they can leave the monitoring to DemandTrigger and receive a notification only when the product reaches a price they're actually willing to pay.
Brand managers need more than historical sales reports to understand demand.
Aggregated watchlists and target prices reveal customer intent before purchases happen, helping brands make smarter pricing, promotional and inventory decisions.
Designing for two users meant every feature had to answer one important question.
Throughout the project, I made a series of product decisions that shaped both the user experience and the platform architecture.
Generic price alerts keep users informed, but they don't necessarily help them decide when to buy.
By allowing users to define their own target price, every notification becomes personal and directly tied to a buying decision rather than a retailer's pricing activity.
What started as a consumer-focused product evolved after I realised that watchlists and target prices represented valuable business data.
One dataset could power two completely different value propositions without duplicating effort.
Although both dashboards are powered by the same underlying data, they answer completely different questions.
Consumers want to compare prices, understand price history and find the best deal available today. Brand managers, on the other hand, need insights into customer demand, pricing expectations and market competitiveness.
Combining both experiences into a single dashboard would have created unnecessary complexity for consumers while limiting the depth required by brands. Keeping them separate allowed each dashboard to be designed entirely around its primary user.
Sending notifications every time the scraper detected a product below its target price would have been easy to implement, but it would quickly become repetitive and frustrating for users.
Instead, I designed the notification engine to alert users only when a product first reaches their target price or when the retailer changes the price again.
The objective wasn't to send more notifications. It was to ensure every notification remained relevant and worth opening.
While platforms like WhatsApp offer faster delivery, they also introduce additional platform dependencies, approval processes and integration complexity.
Email provided a reliable and straightforward way to validate the end-to-end notification workflow while keeping the focus on the core product experience.
Once the platform evolves beyond the MVP, additional delivery channels such as WhatsApp, push notifications and SMS can be introduced without changing the underlying notification engine.
Once the core product experience started taking shape, I shifted my attention to how the system should be built—not just for the current version of DemandTrigger, but for how it could evolve as more retailers, users and analytics were added over time.
I wanted an architecture that was easy to extend, simple to maintain and capable of supporting both operational workflows and business reporting.
Rather than optimising purely for today's requirements, I wanted each component to have a clear responsibility so that new features could be added without disrupting the rest of the platform.
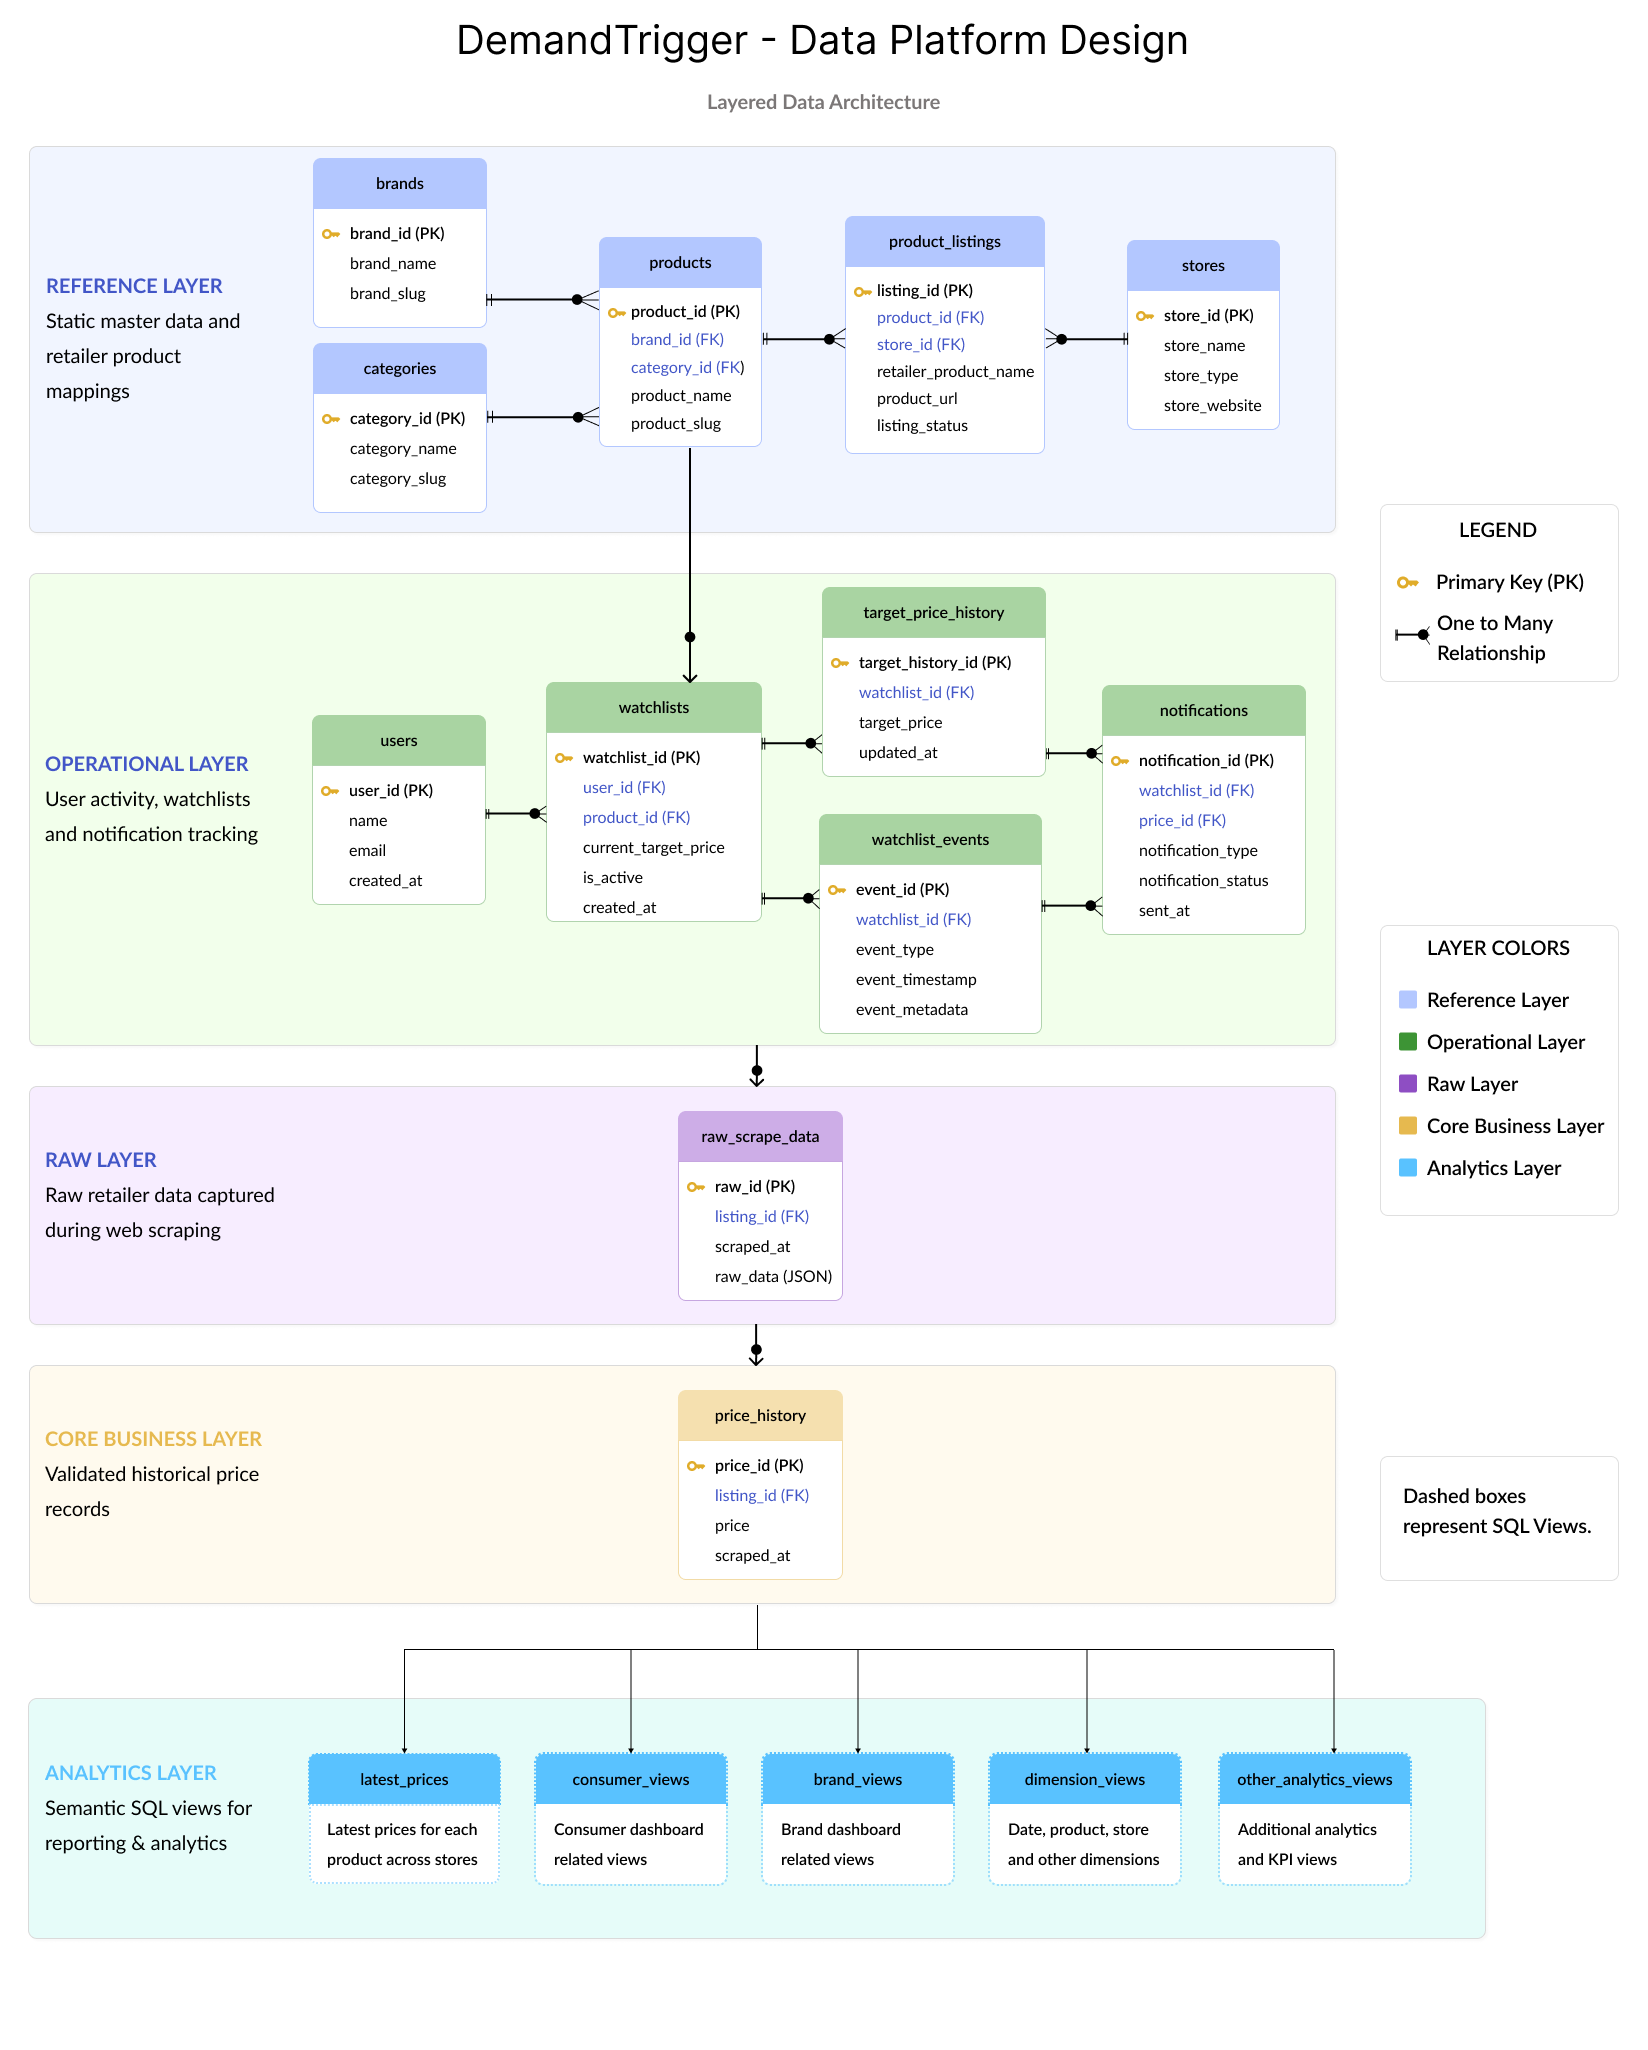
Instead of storing everything in a single set of tables, I separated the platform into distinct layers for reference data, operational data, raw scraped data, core business data and analytics.
This made each layer responsible for a single purpose. Scrapers only write raw data, ETL pipelines handle transformation and the analytics layer focuses entirely on reporting.
Keeping these responsibilities separate makes the system easier to maintain and allows new features to be added without affecting the entire pipeline.
As I started building the Power BI dashboards, I realised that connecting directly to operational tables would force every report to recreate the same joins, calculations and business logic.
Instead, I built a semantic SQL layer exposing business-ready views such as Current Price, Store Comparison and Watchlist Summary.
This keeps reporting logic centralised in SQL, simplifies dashboard development and makes the analytics layer easier to maintain as the project evolves.
One of the earliest technical decisions was to keep every retailer scraper independent. Rather than writing one large scraper that handled every website, each retailer has its own scraper module with a shared utility layer.
This allows individual scrapers to be updated whenever a retailer changes its website without affecting the rest of the pipeline.
Adding support for a new retailer also becomes a matter of creating a new scraper module instead of rewriting existing logic, making the platform easier to maintain and extend over time.
It would have been simpler to overwrite product prices every time the scraper ran. Instead, I chose to store every price change as historical data and use an ETL process to transform raw scraped data into a structured price history.
This preserves a complete record of how prices change over time, making historical analysis, trend reporting and future analytics possible.
More importantly, it keeps data collection separate from data transformation, resulting in a cleaner, more reliable and more scalable pipeline.
Once the data pipeline was in place, the next challenge wasn't collecting more data—it was presenting it in a way that helped users answer meaningful questions.
Rather than building a dashboard filled with charts, I started by asking what each user actually wanted to know before designing a single visual.
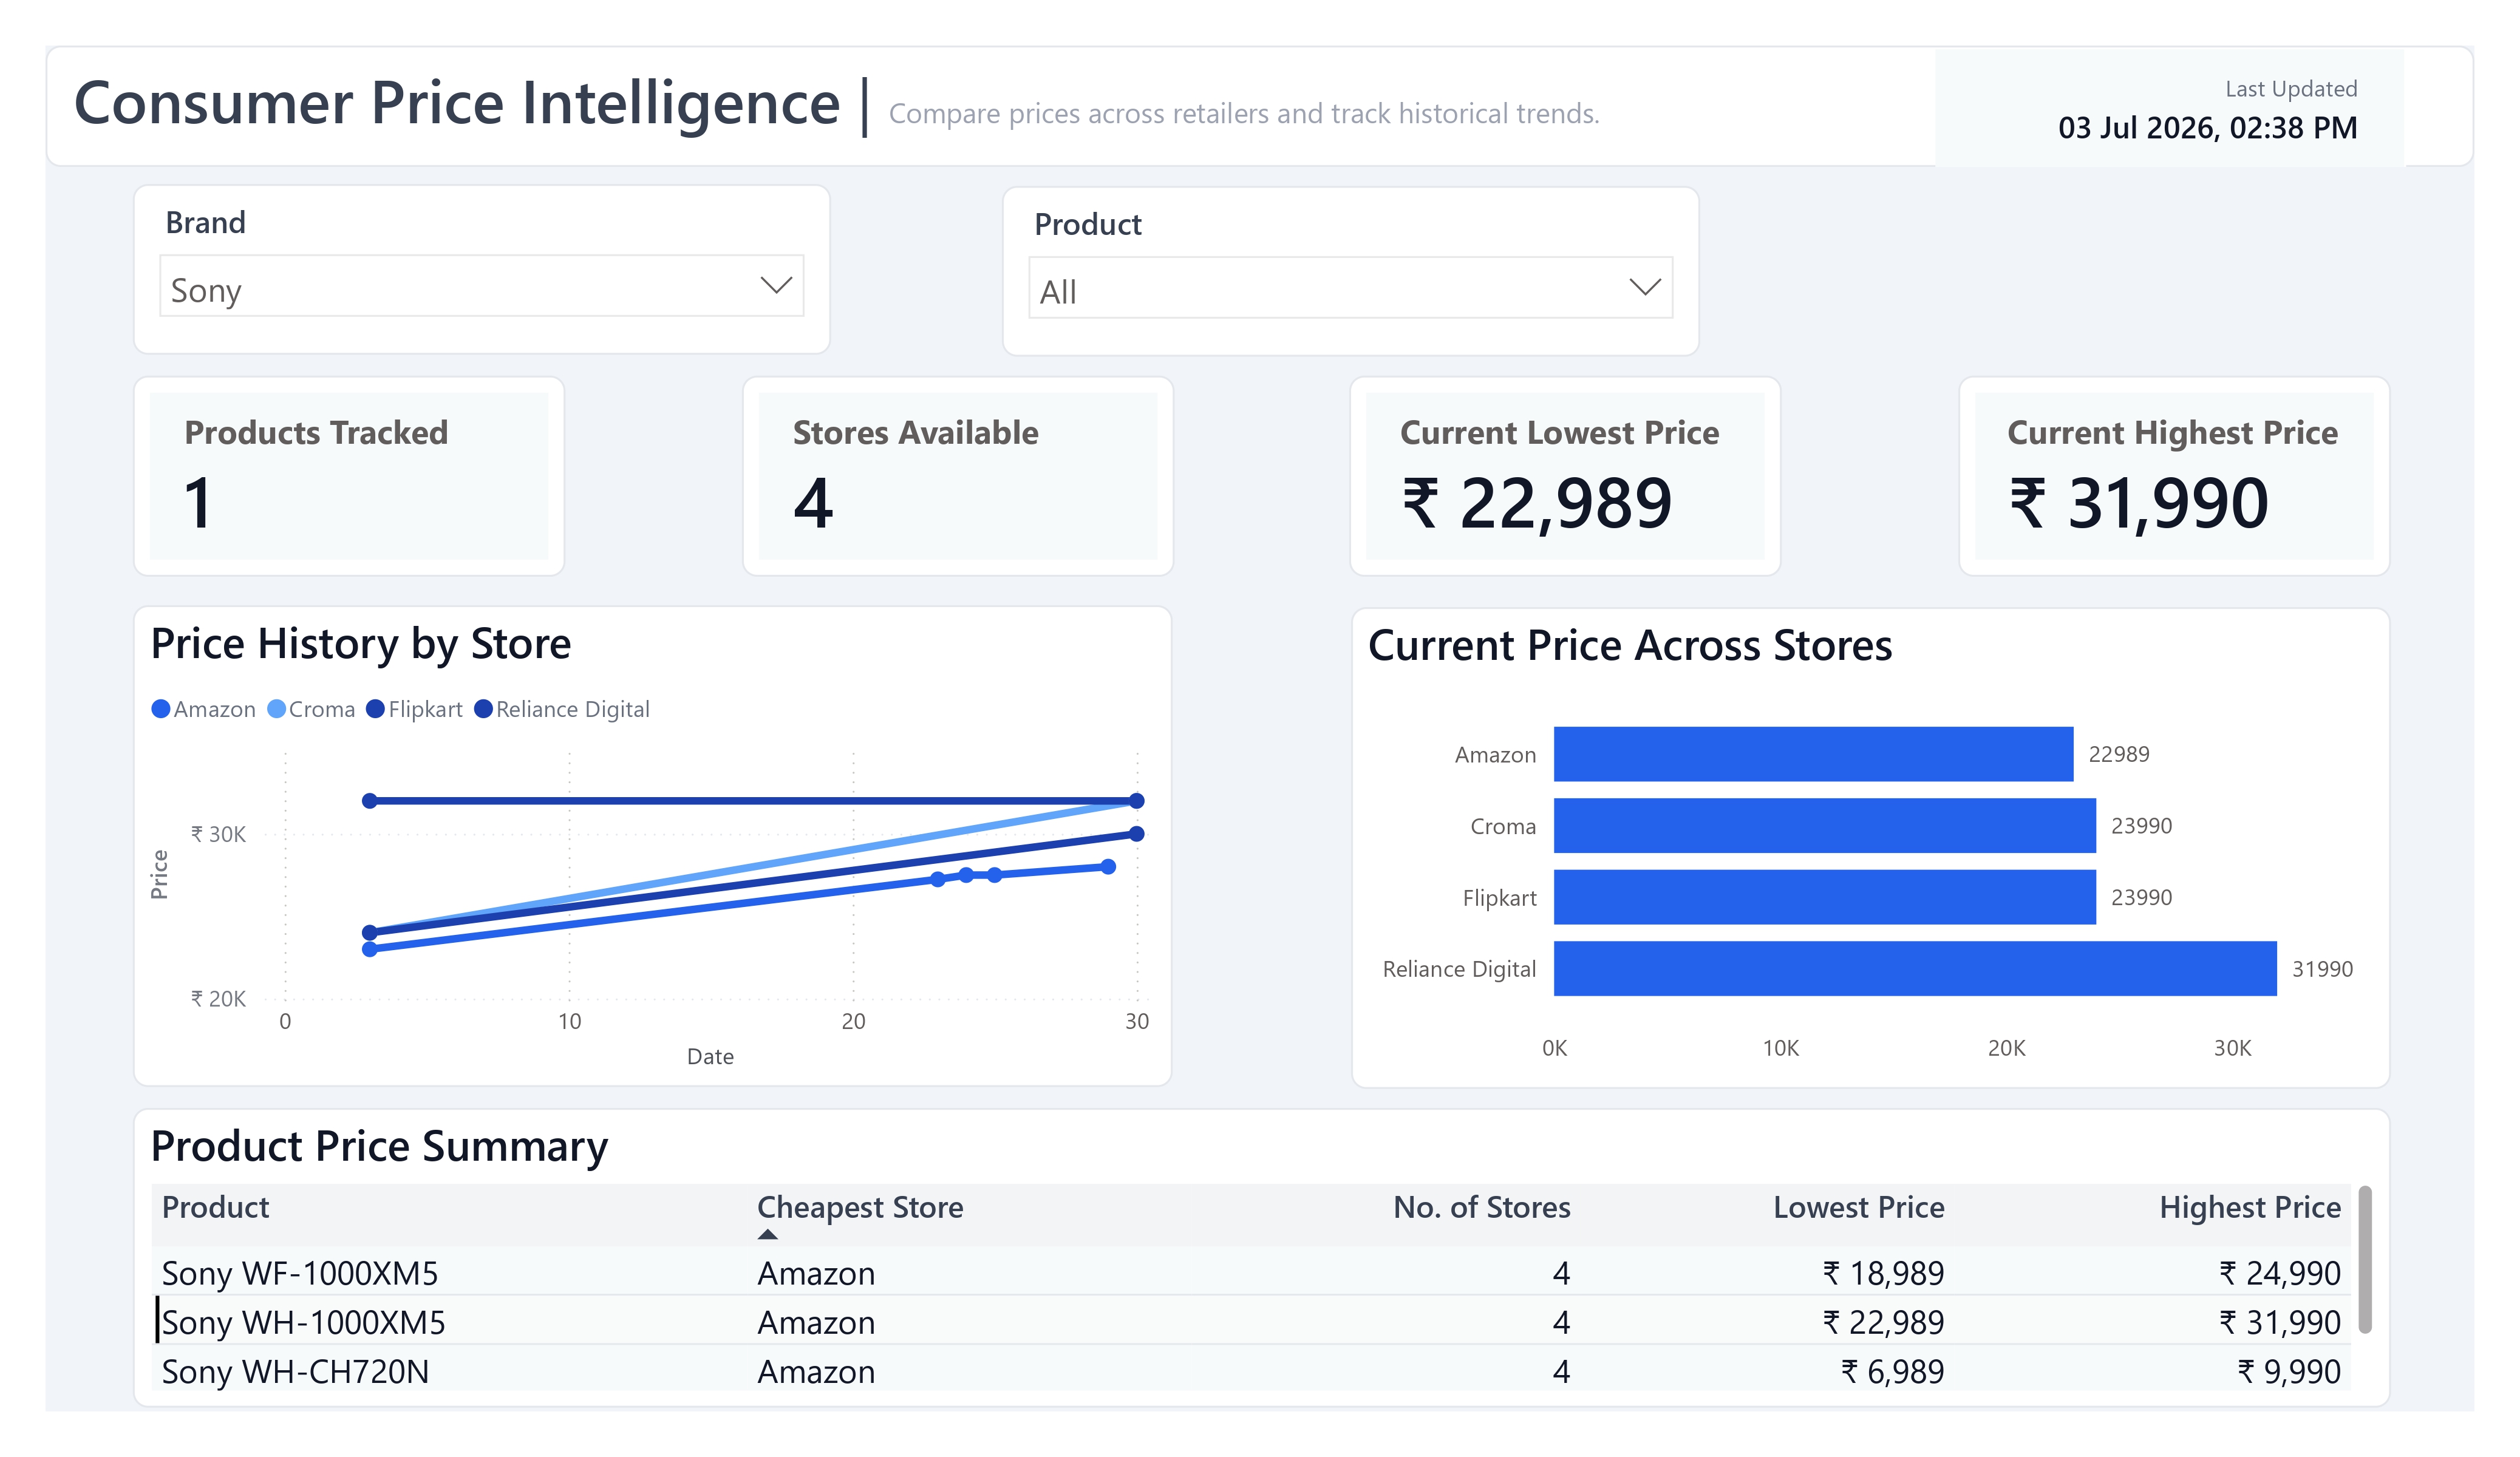
Before designing the consumer dashboard, I asked myself:
Brand managers, on the other hand, needed answers to a completely different set of questions:
Those questions naturally led to two separate dashboards. Although both dashboards use the same underlying data, each one is designed around the decisions its users need to make.
While designing the dashboards, I made a conscious effort to avoid adding visuals simply because the data existed. Every KPI, chart and table had to answer a specific business question. If a visual didn't help a user make a decision, it didn't make it into the final dashboard.
This also influenced the visual design. I kept the layout simple, limited the colour palette and used colour primarily to draw attention to important information, such as highlighting the cheapest retailer for a selected product.
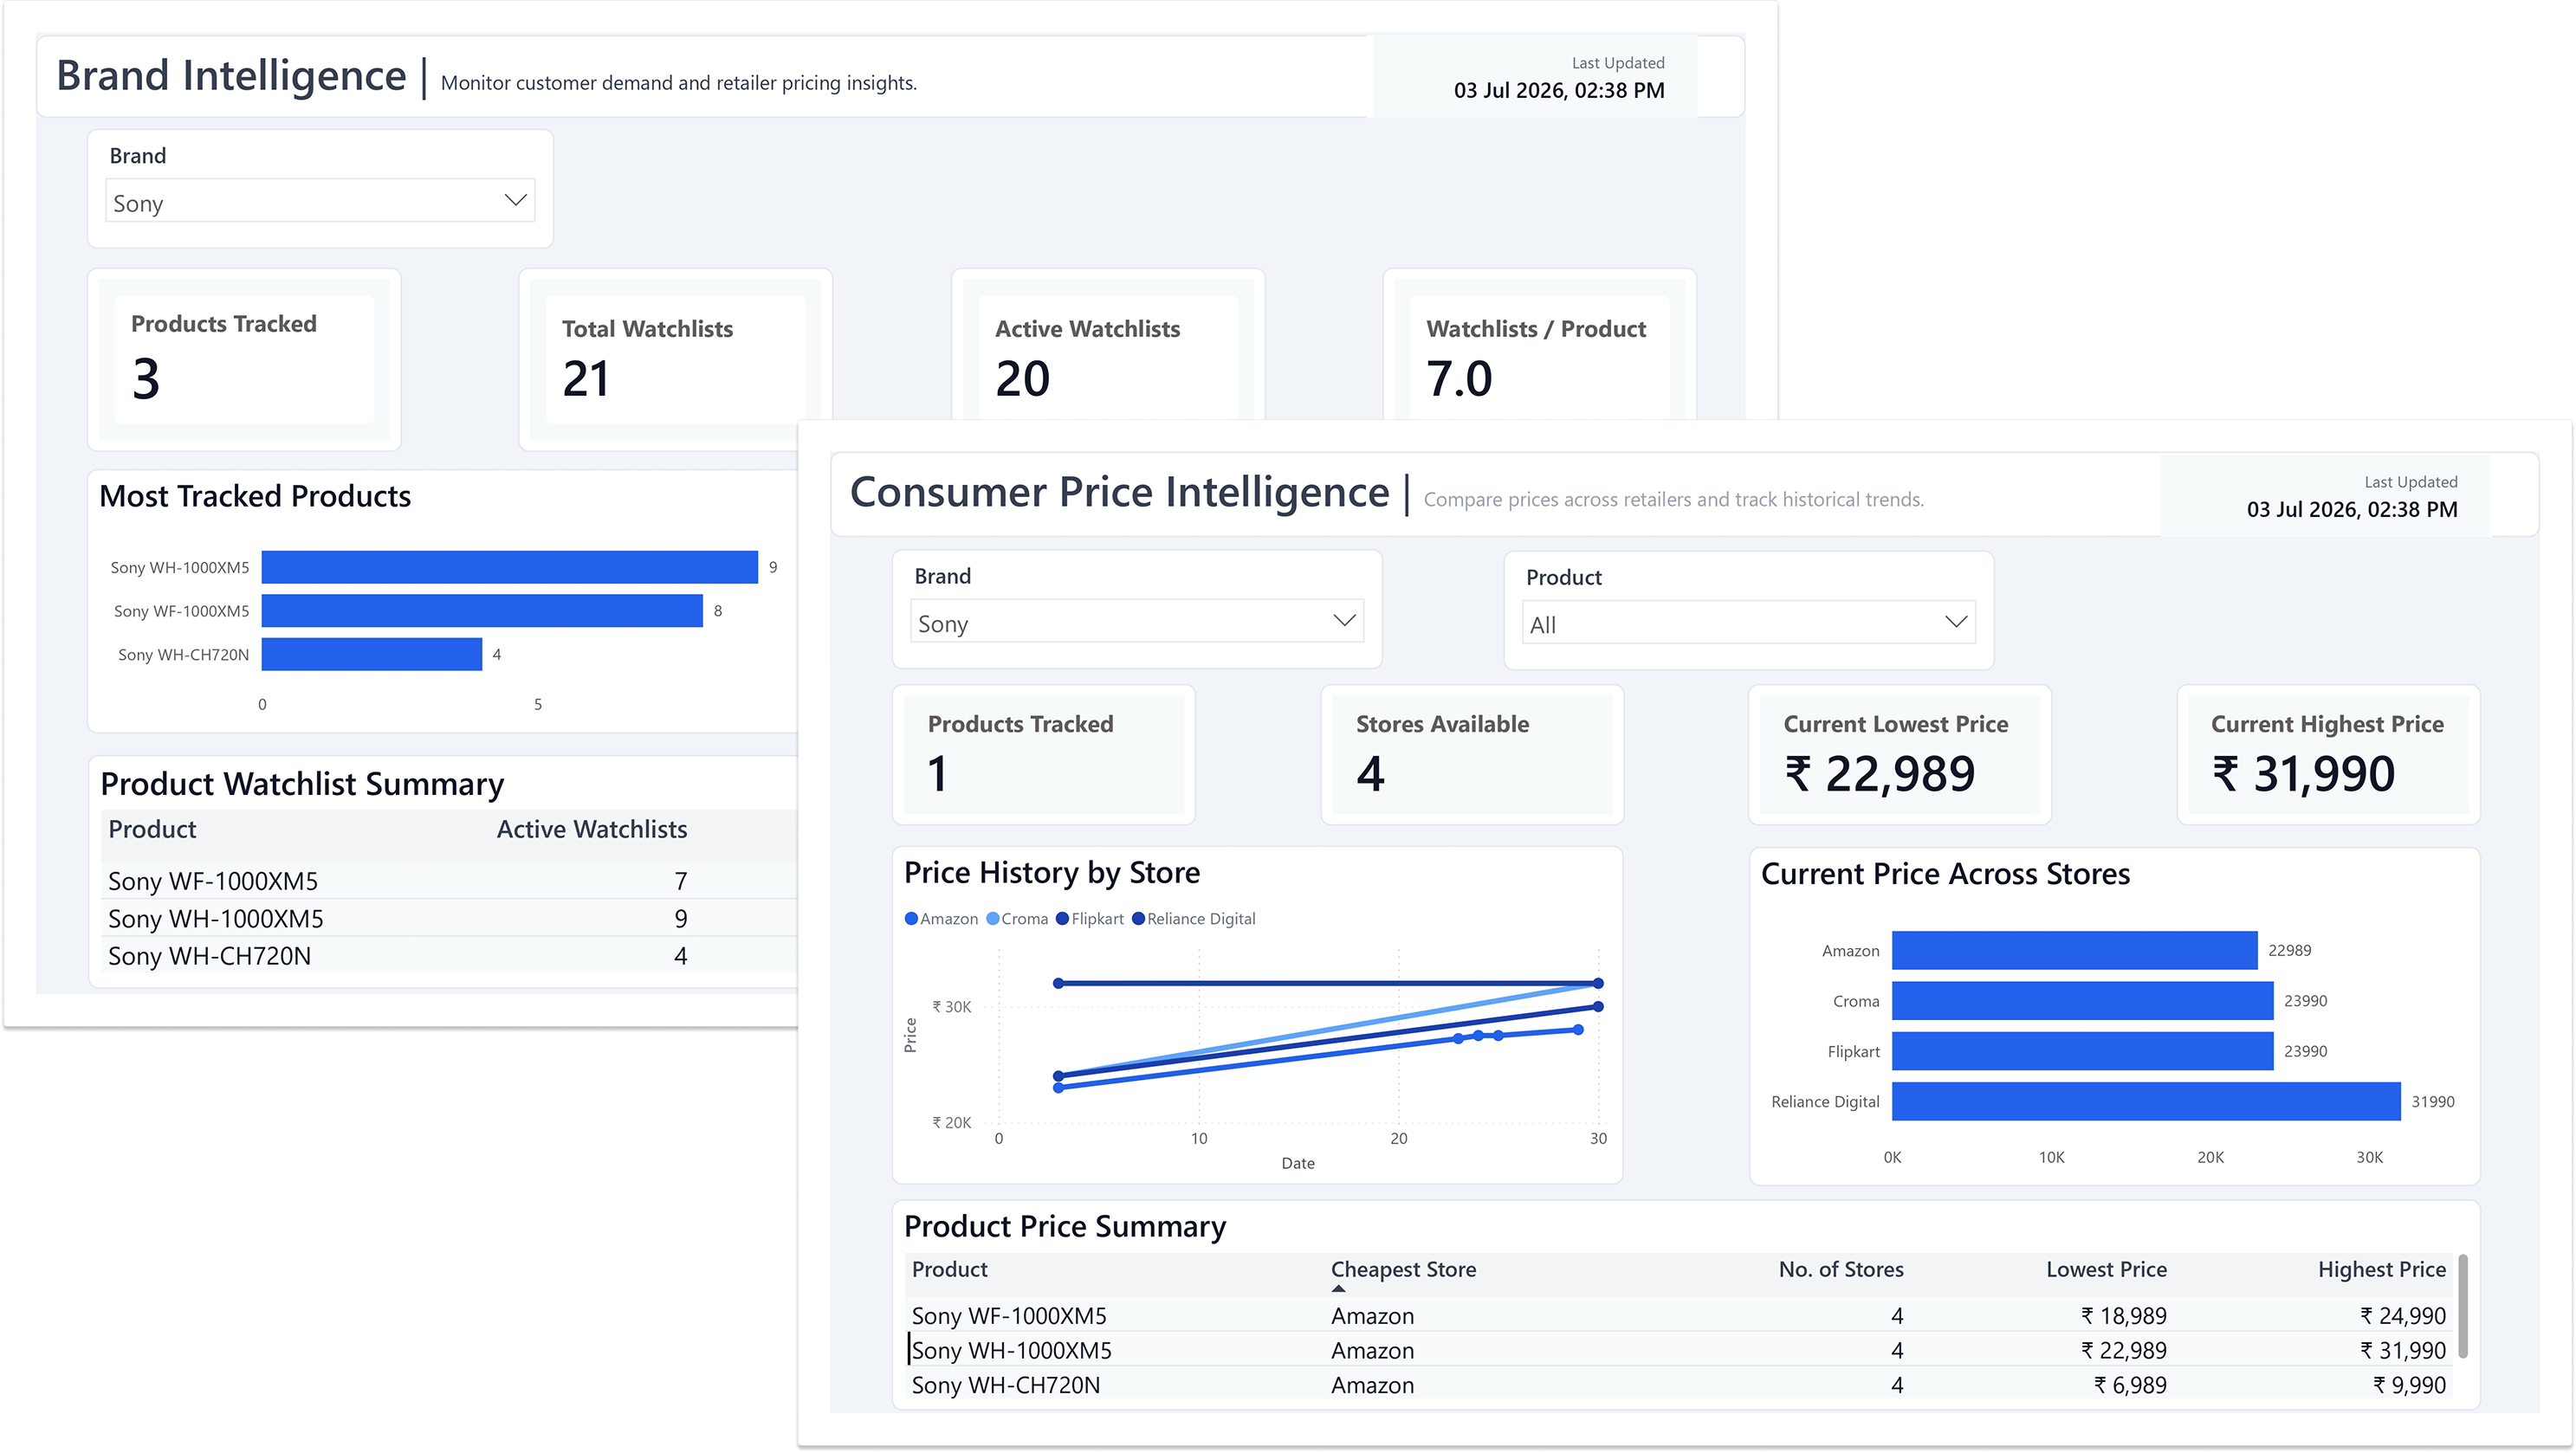
Although both dashboards are powered by the same data platform, each one is designed around a different set of user decisions.
Designed to help consumers compare prices, understand historical trends and make informed purchase decisions.
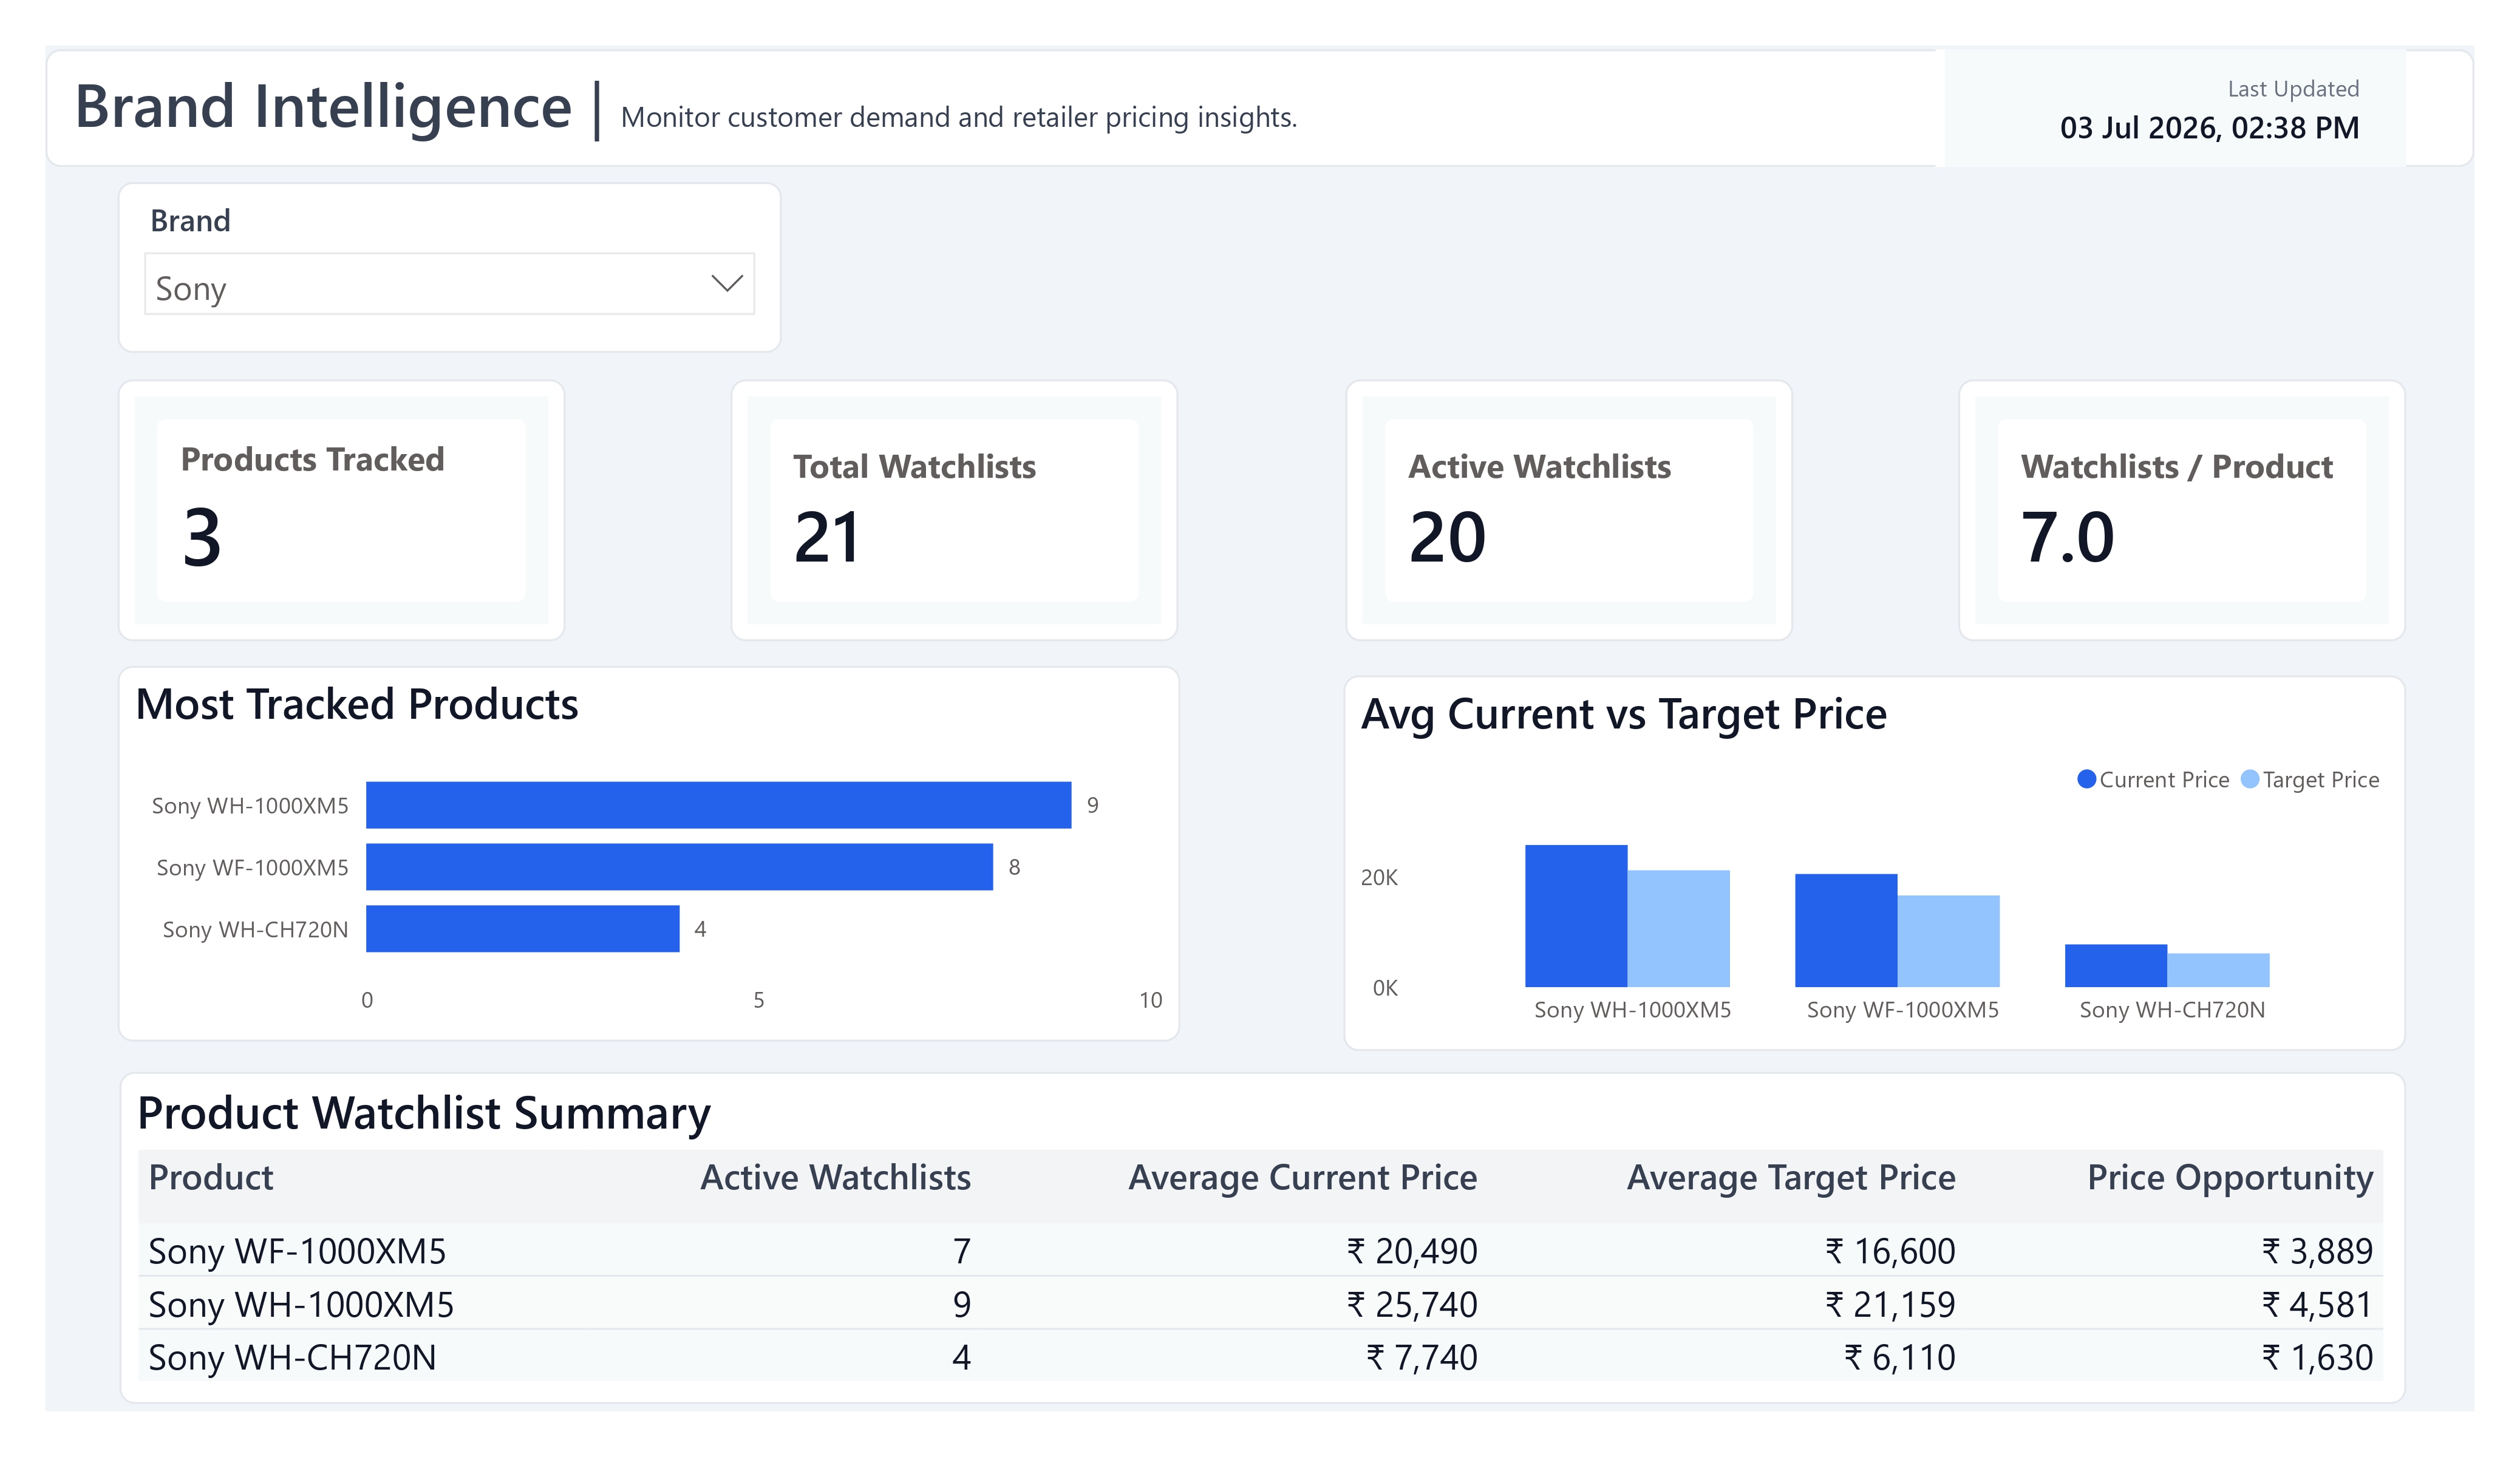
Designed to help brands understand customer demand, pricing expectations and market competitiveness.
No product evolves exactly as planned, and DemandTrigger was no exception.
Product mapping across retailers turned out to be the most stubborn operational problem in the platform. The same product listed on different retailers can have different names, URLs, images and descriptions, making reliable automated matching extremely difficult.
Rather than investing significant effort into a machine learning solution, I chose a pragmatic approach for the MVP by maintaining a curated product-to-listing mapping for each retailer. While this introduces manual effort, it allowed me to focus on validating the core product experience before solving a much larger scalability problem.
Product mapping was the biggest architectural challenge, but it wasn't the only trade-off. Throughout the project I also had to balance simplicity with scalability, avoid overwhelming users with repetitive notifications and design analytics that served both consumers and brands without compromising either experience.
DemandTrigger is a complete MVP, but the architecture was deliberately designed to support future evolution without requiring fundamental changes.
Enable users to create accounts, manage watchlists and discover products without manually adding retailer URLs.
Introduce APIs for authentication, user management and cloud-hosted pipeline execution.
Expand the platform with personalised consumer recommendations and richer long-term brand demand insights.
DemandTrigger challenged me to think beyond features and focus on the decisions behind them. It pushed me to balance product thinking with technical architecture, design systems that could scale and use data not just to report what had happened, but to help people make better decisions.
The question that started all of this was a simple one:
"Not 'What is the current price?', but 'What price am I actually willing to pay?'"
That shift in question produced the product. More importantly, it reinforced a way of thinking that I'll carry into every product I build in the future.